There is a debug functionality which lets you better comprehend the build up of a chosen assembly configuration (choosing a row in the table).
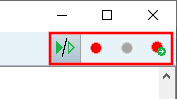
Top right you can find the debug buttons:
If  is activated, each part/sub-assembly has an extra breakpoint on/off [Breakpoint on/off] button (
 |
|  ) at the top right (see Fig. „Breakpoint on“).
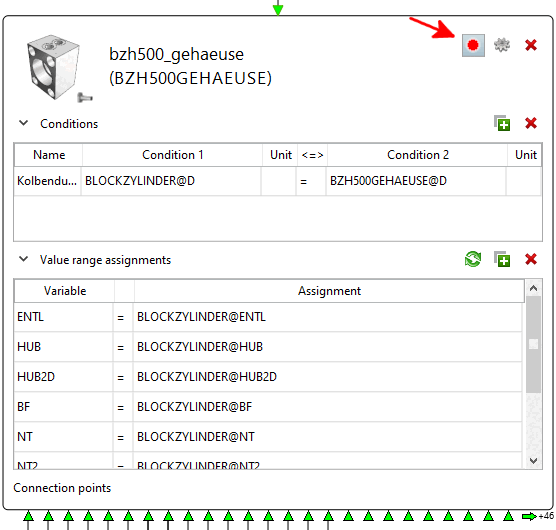
With this so-called breakpoint, you can add the part/sub-assembly to the monitored parts/sub-assemblies of the debugger. With the two buttons that look exactly like this in the toolbar of the graphical assembly editor ( |
|  ), you can activate and deactivate the breakpoints of all parts/sub-assemblies (see Fig. „Debug
buttons“).
), you can activate and deactivate the breakpoints of all parts/sub-assemblies (see Fig. „Debug
buttons“).
If the debug mode is activated and some or all breakpoints are activated and if a special assembly configuration is now selected (selected table row), the debugger stops at each newly inserted part/subassembly. The debugger zooms to the rule that inserted the current part/sub-assembly and shows the relevant value of the rule condition. If you want to continue, you must click the Go to next active breakpoint [To next active Breakpoint]
 button in the toolbar (see Fig. „Debug
buttons“). Once the button has been clicked, the debugger jumps to the next breakpoint. A breakpoint can concern the following:
button in the toolbar (see Fig. „Debug
buttons“). Once the button has been clicked, the debugger jumps to the next breakpoint. A breakpoint can concern the following:
![[Note]](https://webapi.partcommunity.com/service/help/latest/pages/jp/partsolutions_user/doc/images/note.png)
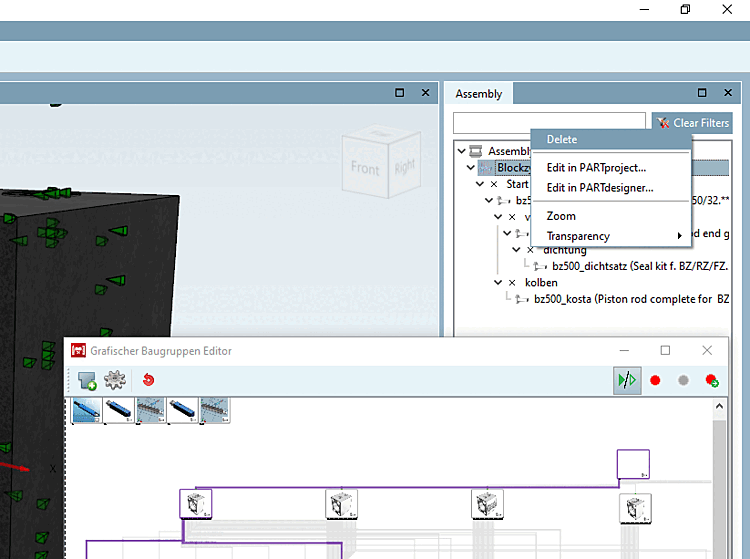
The debugger only stops for parts/sub-assemblies that are newly added, so if you want to go through the structure of an assembly again, you must delete the start element in the assembly [Assembly] docking window (see Fig. „Delete start element“).