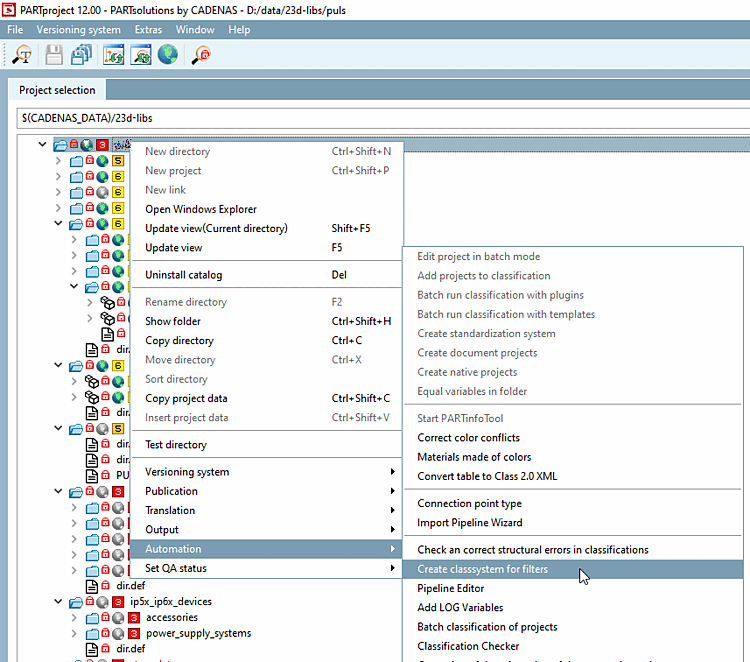
Execute the command Create class system for filters (under Automation ) on the catalog root directory or any subdirectory.
At this point, you have the option of selecting an existing report in the list field and loading it by clicking on . This is very time-saving compared to generating a new report, especially for entire catalogs. In the case of a fresh installation, nothing is displayed in the list field. However, you can use to browse to any report directory, which is then opened immediately.
Optional: Remove the PREMIUM/CERTIFIED quality status from projects if the new status is basic-minus.
Optional: Write quality results in the project [Write quality results into the project]
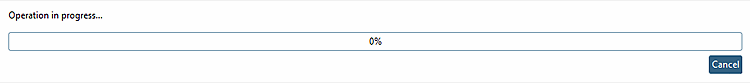
-> The calculation is started for the directory selected in the tree and the progress is displayed.
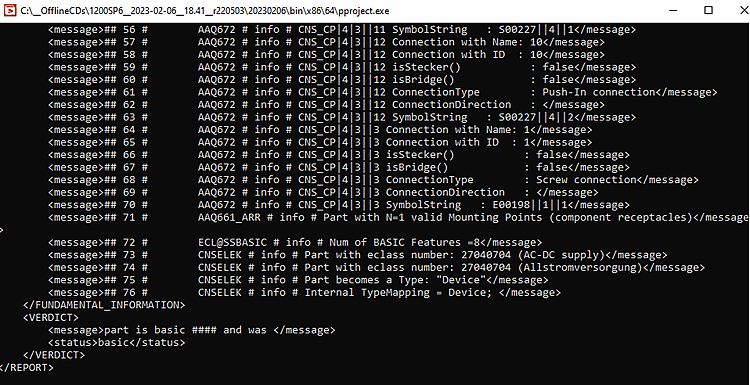
-> In parallel you can see respective log details in a command window.
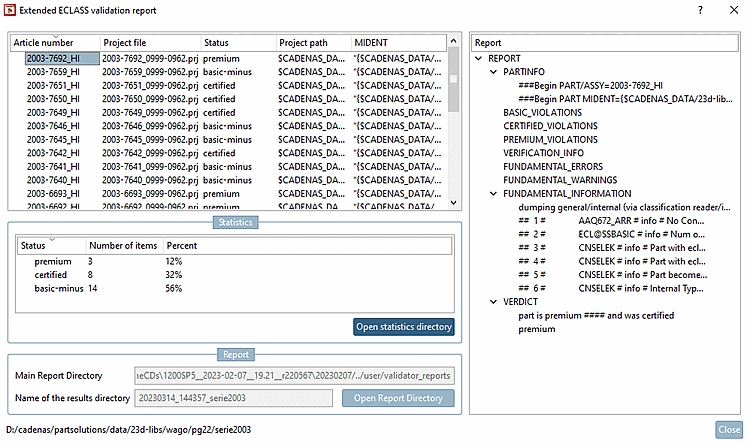
As soon as the calculation is complete, the Extended ECLASS Validation Report [Extended ECLASS validation report] dialog box opens.
The table shows the columns Article number, Project file, Status, Project path and MIDENT.
As soon as you select an article number, details, in particular the entries that prevent a product from reaching a certain status, are displayed on the right in the Report details dialog area. Details can be found below.
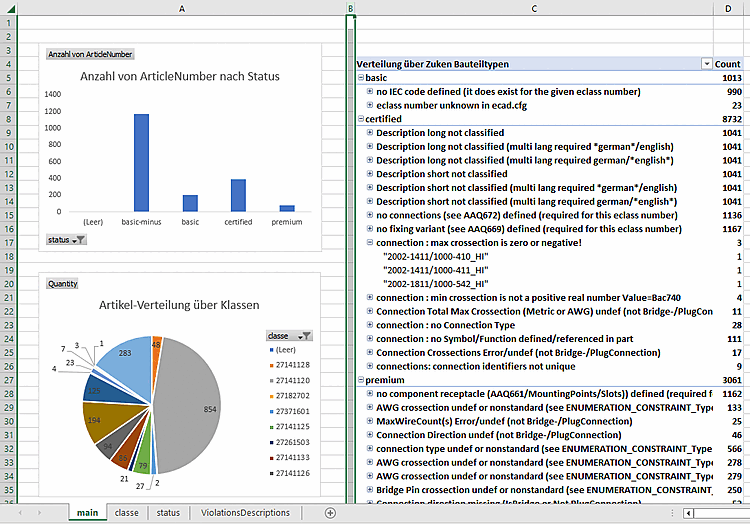
The Statistics dialog area shows the percentage distribution of items across the premium, certified, basic-minus and basic certification levels.
The button opens the current report directory in the user directory under "validator_reports" and copies the template file
statistics.xlsxinto it.The button opens the current report directory in the user directory under "validator_reports".
![[Note]](https://webapi.partcommunity.com/service/help/latest/pages/jp/partwarehouse/doc/images/note.png)
Note If you close the dialog by clicking on , it can only be reopened by running it again. However, the dialog view is not an advantage, as you have full access to all information via the Excel view and access to the generated XML, text and CSV files in the report directory. See Section 5.12.11.28.5.4, “Evaluation”.
Click on the button. (If an error message appears, there is an error in the settings. See Section 5.12.11.28.5.2, “Requirements / settings / notes”.)
-> Under
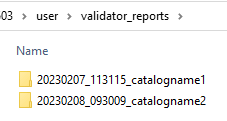
$CADENAS_Userthe "validator_reports" directory is opened and the filestatistics.xlsxis copied to the report directory of the current run.Open the desired report directory under
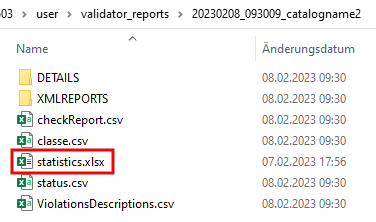
$CADENAS_USER/validator_reportsto open the desired report directory.Double-click the Excel file
statistics.xlsx.In addition to
statistics.xlsx, the results data of the test run can be found, on the basis of which the presentation is made in Excel.Details on the files contained in the report directory can be found under Section 5.12.11.28.5.4, “Evaluation”.
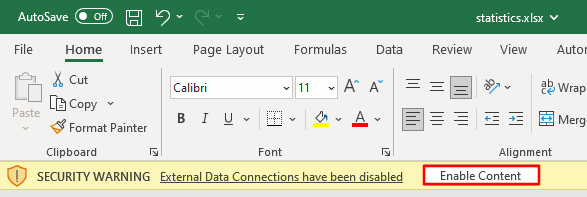
Activate the content to be able to update statistics through the CSV files of the last run.
Select each chart and table one after another and always use Alt+F5, in order to update the representation with the last test data.
!["Create class system for filter [Create class system for filters] " dialog](https://webapi.partcommunity.com/service/help/latest/pages/jp/partwarehouse/doc/resources/img/img_25f7cdf7b07940ff903219b3ce8dd4c4.png)