
Clicking on the Show variable dependencies button button opens the Variable structure [Variable dependencies] dialog box.
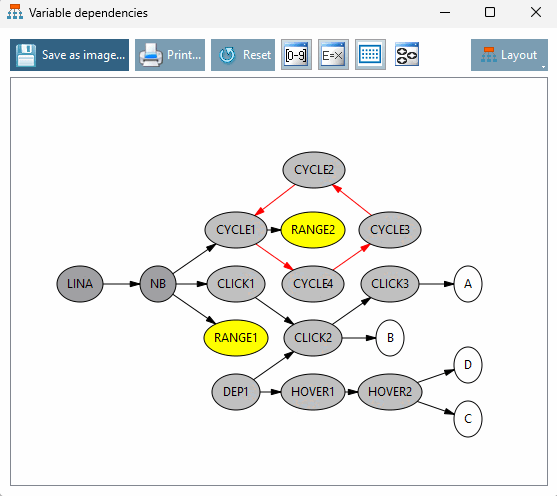
In the illustration above, you can see that various variables are linked to each other. The colors displayed are broken down as follows:
In addition, the connecting arrow is displayed in a different color in each case. These are broken down as follows:
Above the display
of the variable dependencies, you will find various ways to
influence the presentation of the variables. In addition, the
Variable dependencies directly as an image file ( *.png )
on your computer. Click on the button
Print... to either view the entire graph
or just the current section. The
Window Printer Properties of Windows, in
where you can specify the printer and some basic settings.
In addition, you can use Reset to
Reset view back to default. This takes into account the
applied filter and layout, so that only the manual moves
can be reversed.

![[Note]](https://webapi.partcommunity.com/service/help/latest/pages/jp/partsolutions_user/doc/images/note.png) | Note |
|---|---|
You should first adjust the desired display options before you move the variable dependencies manually. This is because manually moved elements are reset when a filter is activated! | |
The following options are available to change the view of the variable dependencies:


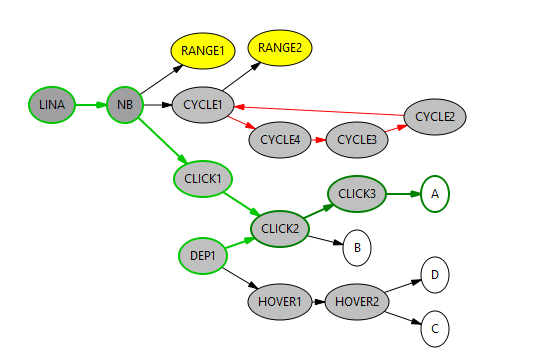
Display dependencies of any variable
You can display the dependencies of any variable by selecting it with a left-click. The selected variable and all directly dependent variables, as well as variables connected one level higher or lower, are displayed with a green border and arrow. The selection can be canceled by left-clicking on an empty area.
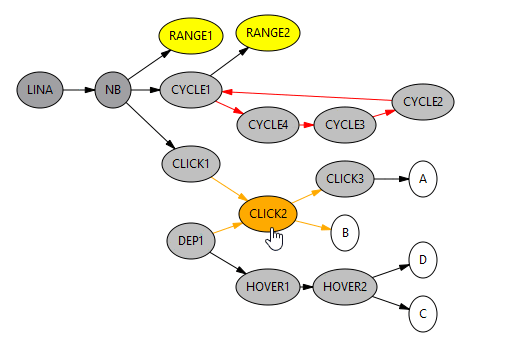
Highlighted marking of variable dependencies when moving the mouse pointer over a variable
If you move your mouse pointer over any variable, all dependencies are highlighted with an orange color. The colored highlighting is only displayed for as long as the mouse pointer remains over the corresponding variable.
If the filter is set appropriately, you can move the displayed variables as required using 'Drag & Drop'. Click on any variable and hold down the button to move the variable. The displayed dependencies remain and move with you. A variable can be moved as often as required.
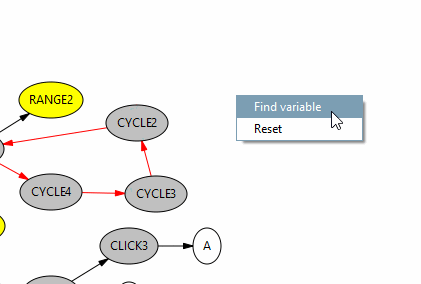
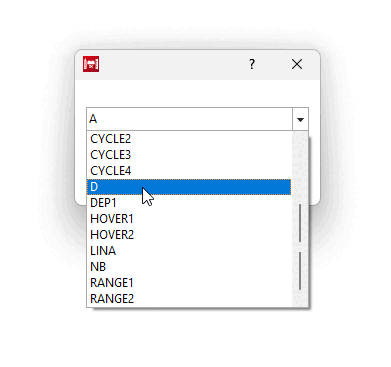
Right-click anywhere to open a context menu, click on Find variable and select a variable in the dialog box. As soon as you click OK, the view is centered on the variable you are looking for.
You can reset the view by right-clicking anywhere and pressing Reset. The function is identical to the button above the display.
Context menu: Display variable dependencies [Show variable dependencies]
You can also display the dependencies of a variable individually by right-clicking on the desired variable and selecting Show variable dependencies. The view then reloads and now only displays all dependencies for the selected variable. A note appears in the ribbon indicating which dependencies are displayed.
![[Important]](https://webapi.partcommunity.com/service/help/latest/pages/jp/partsolutions_user/doc/images/important.png)
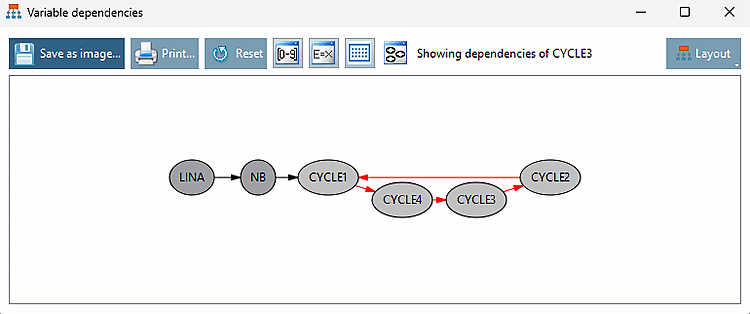
To avoid errors, look out for double arrows and dependencies that form a cycle: These indicate a recursive algorithm.
The
The following example figure shows a recursive dependency. The
Variable Manager displays CYCLE1=CYCLE4=CYCLE3=CYCLE2. In the dialog box
variable structure, [Variable dependencies] you will see a cycle of
Dependences. In the 3D history [3D History] at
affected elements a red cross, the Notifications dialog box shows the error, and
the 3D
View shows no model.
a red cross, the Notifications dialog box shows the error, and
the 3D
View shows no model.
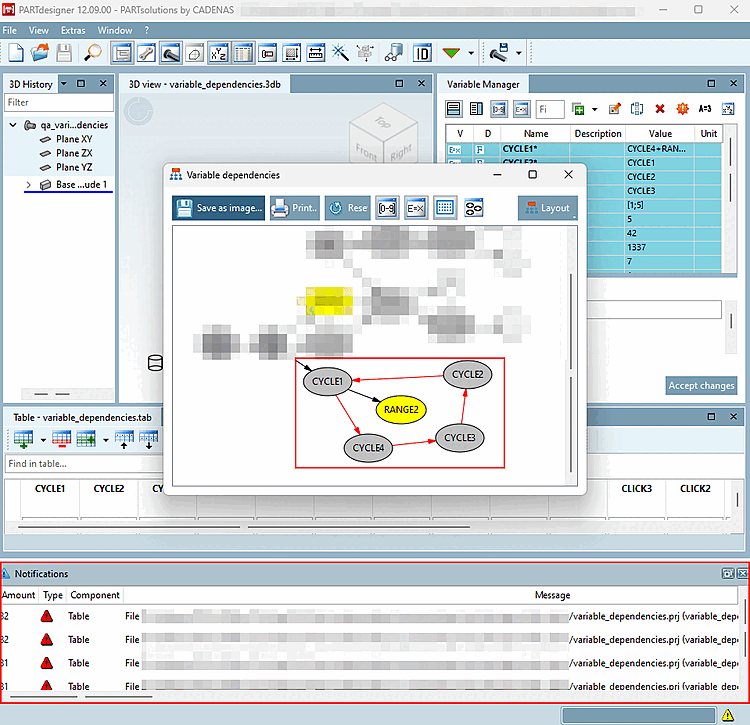
The error message Recursion in algorithm appears in the QA check dialog box.